
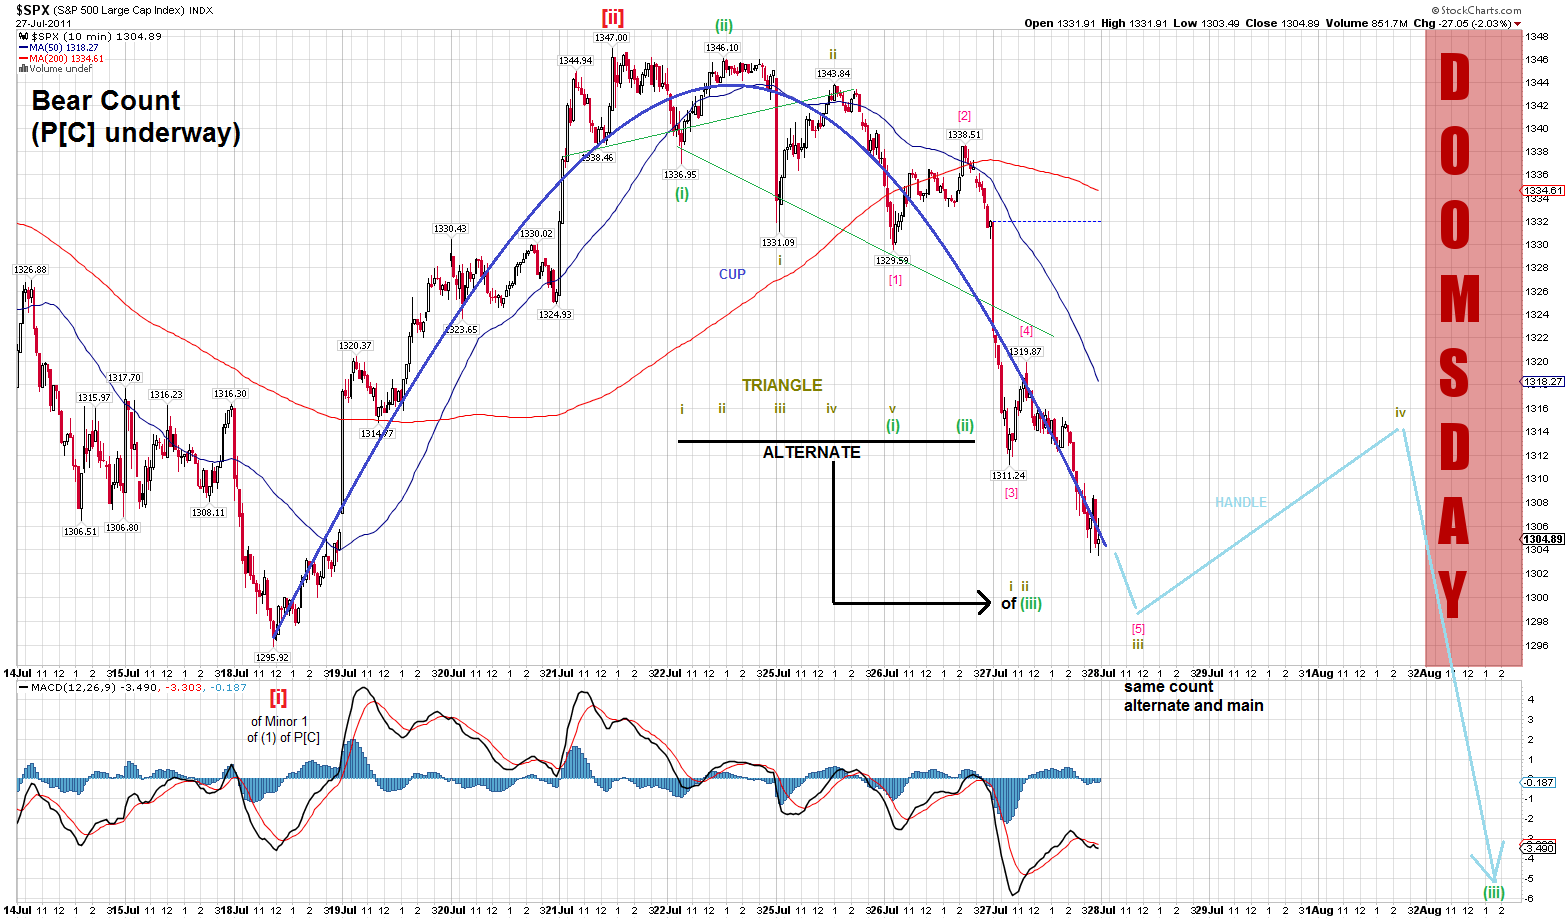
All the same, however, the entire action from July 18 to now has been essentially in the shape of a cup (of an inverted cup and handle formation), which suggests a couple days of rallying when it bottoms and then more downward action to come. It doesn't hurt that there are a couple of head-and-shoulders formations as well there that have panned out. The bearish count is shown below - I particularly like the expected timing on this, as it would allow Subminuette wave v of (iii) of [iii] down to occur on Doomsday (the debt ceiling day, August 2). Note that this could also be Daneric's [e] wave.
The EUR/USD (not shown) has also shown a nice inverted cup and handle formation from 8 p.m. Eastern Monday night to the present, along with a couple of heads-and-shoulders as well. Based on the necklines from these patterns and on the slopes of the lines that the "handle" has shown since it started at around noon today, I would expect a recovery in the euro to between 1.4419 and 1.4448 sometime between 9 p.m. tonight and 9 a.m. tomorrow. (Of course, the last time I made a prediction on the euro...) Disclosure: I am long UUP.
Pebblewriter has an intriguing theory that the market is in essentially a Groundhog Day loop at a lower price range, replaying 2007-8 all over again. According to this theory, today was an analogue of December 31, 2007 - we're essentially offset by about 43 months, give or take a few days (the 3 1/2 year cycle in action?). The true "market crash" as it is generally thought of (...of 3 of (3) of P[A] by my count) occurred in mid-September to mid-October 2008; the market bottom happened in March 2009. If this theory is valid, this would be mid-April to mid-May next year, with the market bottoming in October 2012.
...What happens shortly after October 2012?
No comments:
Post a Comment