Saturday, July 30, 2011

Debt ceiling minus 60 hours

The "Bullish 1" alternate count from Thursday's annual charts was violated yesterday as the SPX dipped well below the invalidation point.  The salient possibilities are thus my bearish main count and my alternate "Bullish 2" count, which we are in or have just completed (c) ending [ii] of Minor 5.  This alternate count is similar to Daneric's Minor 4 triangle count, in which we just completed (c) ending [e] ending Minor 4; the primary difference is that if my Bullish 2 count is right, the remainder of the up wave should see three more waves, whereas if Daneric's triangle count is right, there should be five waves up to come (unless the intraday up-and-down Friday was Minute [i] and [ii], but...).


For what it's worth, the debt ceiling could be interpreted several ways:

1. No deal.  People pour money into equities/commodities fearing hyperinflation.  Bullish stocks.
2. No deal.  People take money out of stocks on the grounds of US weakness.  Bearish stocks.
3. A deal is made.  People pour money into equities/commodities on the grounds that the world is not going to end (sell the rumor buy the news).  Bullish stocks.
4. A deal is made, but it's perceived as a temporary fix or otherwise bad.  Bearish stocks.

Even with the dollar it could be interpreted several ways:

1. No deal.  People sell their dollars fearing hyperinflation.  Bearish the buck.
2. No deal.  People flee risk assets and bonds, and there simply aren't enough Swiss francs to go around (or Switzerland somehow loses its safe-haven status.  Default, perversely, could be bullish the buck.
3. A deal is made, but the simple act of raising the debt ceiling makes people think it's just more of the same.  Bearish the buck.
4. A deal is made, and the feeling that the US is actually doing something is bullish the buck.

IT CAN GO EITHER WAY

Thursday, July 28, 2011

7/28/11

There will be no post tomorrow.  If there is, it will come late.

On Daneric's Elliott Waves, a poster (Thomas LaCour) commented that he used Fibonacci-number-based moving averages (i.e. 55- and 233-period rather than 50- and 200-period), and Bollinger bands of 21 rather than 20.  This seems to be a more phi-friendly way to use these, and I have adopted this strategy at least for this post.  In addition, I set the MACD divergence parameters at 13/21/8 rather than the conventional 12/26/9.


Yesterday's bull count (we are in Minuette (ii) of Minute [iii/v] up) is all but dead; it is still technically valid (and we have a clear eleven waves down which is three), but it has violated the .886 retracement level on both arithmetic and logarithmic scales.  The market must make a distinct and significant upward move tomorrow.  This count could very well be invalidated on the overnight futures market; 1295.92 cannot be breached.

As for the Keller Ridiculous Adoration Portfolio... Well, it was up today.  By a rather considerable amount.  47.51 points, to be exact - just shy of three percent - to close at 1639.05, a new all-time high.  This increase was largely attributable to CROX, which behaved like a penny stock and was up 15.6% ostensibly on earnings.  That huge gap, of course, is probably begging to be filled.

For good measure, my large scale, one-year count is as follows:


I cannot accept the 3-wave rally to the May 2 high to be the top of even a P[B] (let alone a P[2]).  Note that these may in fact be one degree higher (e.g. my Intermediate (B) may be Primary [B] of Cycle b, and so forth), but I doubt it.

Wednesday, July 27, 2011

7/27/11

So, obviously the market didn't sail off today.  In fact, it did quite the opposite, falling to within spitting distance of the 88.6% retracement level.  This level did not breach, which is good, and a deep retracement is characteristic of a wave 2.  For what it's worth, the KRAP was down a whopping 40 points (close:  1591.54), with all five of its components (including the nigh-invulnerable Apple) down for the day.  In fact, everything but CROX was down over 2%, and CROX was down nearly 1.5%.


All the same, however, the entire action from July 18 to now has been essentially in the shape of a cup (of an inverted cup and handle formation), which suggests a couple days of rallying when it bottoms and then more downward action to come.  It doesn't hurt that there are a couple of head-and-shoulders formations as well there that have panned out.  The bearish count is shown below - I particularly like the expected timing on this, as it would allow Subminuette wave v of (iii) of [iii] down to occur on Doomsday (the debt ceiling day, August 2).  Note that this could also be Daneric's [e] wave.


The EUR/USD (not shown) has also shown a nice inverted cup and handle formation from 8 p.m. Eastern Monday night to the present, along with a couple of heads-and-shoulders as well.  Based on the necklines from these patterns and on the slopes of the lines that the "handle" has shown since it started at around noon today, I would expect a recovery in the euro to between 1.4419 and 1.4448 sometime between 9 p.m. tonight and 9 a.m. tomorrow.  (Of course, the last time I made a prediction on the euro...)  Disclosure:  I am long UUP.

Pebblewriter has an intriguing theory that the market is in essentially a Groundhog Day loop at a lower price range, replaying 2007-8 all over again.  According to this theory, today was an analogue of December 31, 2007 - we're essentially offset by about 43 months, give or take a few days (the 3 1/2 year cycle in action?).  The true "market crash" as it is generally thought of (...of 3 of (3) of P[A] by my count) occurred in mid-September to mid-October 2008; the market bottom happened in March 2009.  If this theory is valid, this would be mid-April to mid-May next year, with the market bottoming in October 2012.

...What happens shortly after October 2012?

Tuesday, July 26, 2011

7/26/11

I have decided to show a different wavecount.  This wavecount is similar to Elliott Wave Applied's bullish count.  It does require Minute [iv] to overlap Minute [i] slightly, but the overlap is small and I find it acceptable.

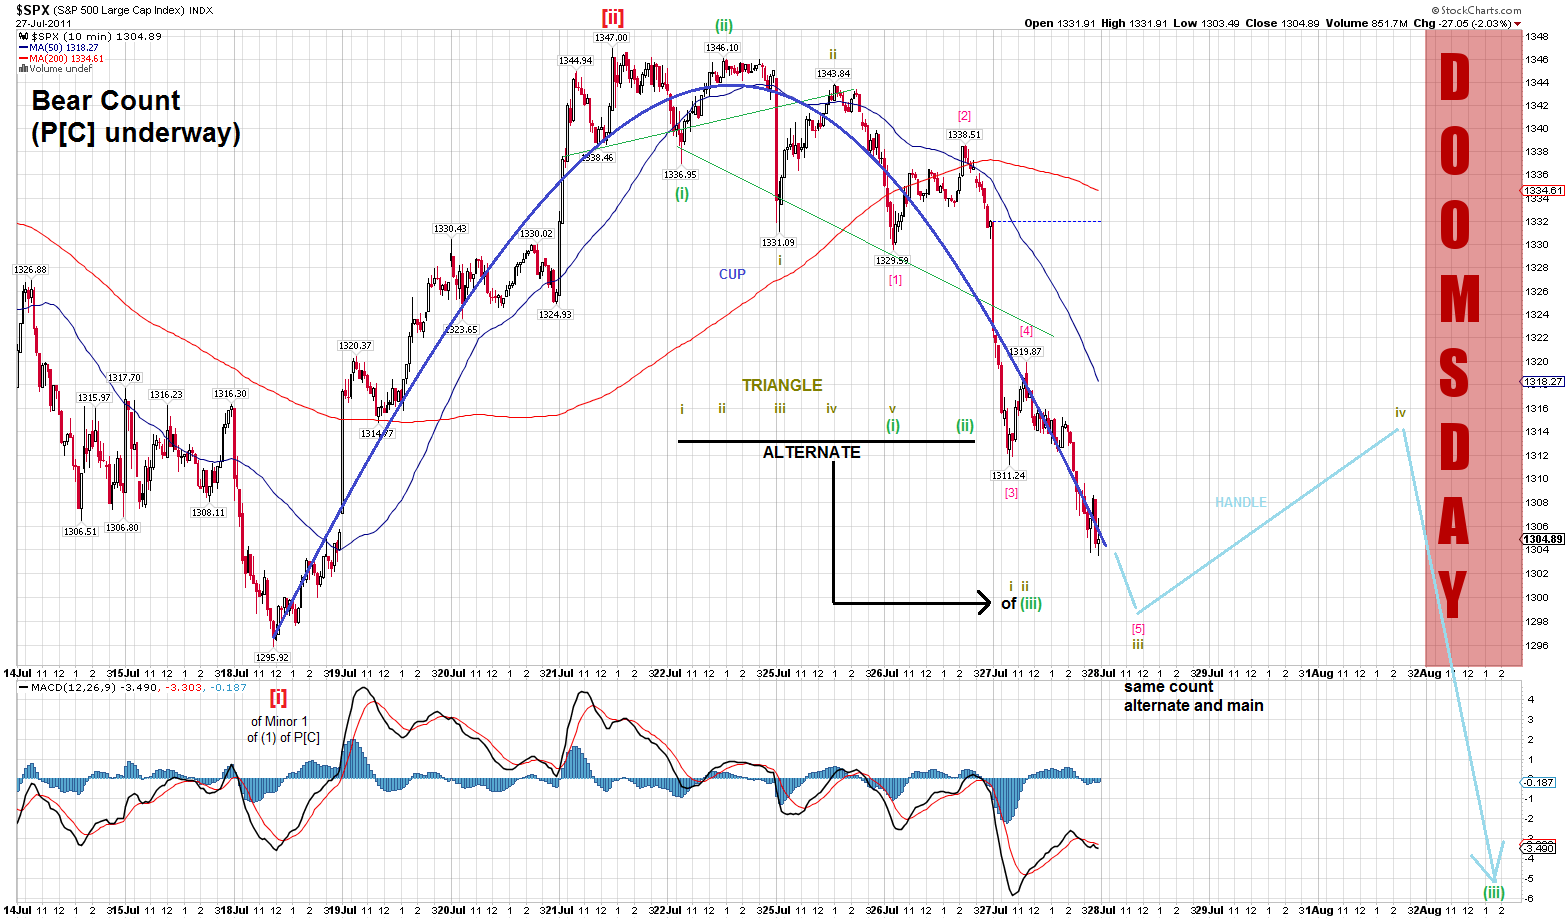
The alternate, superbear count is that P[B] topped on July 7.  (I do not accept the May 2 count, even though May 2 is still the price high in the DJIA, SPX, and RUT, as the rise from the March low was clearly 3 waves). The alternate alternate superbear count is that P[B] was in fact May 2, and we are about to begin 3 of 3 of 3 of 3 of... of 3 of (1/3) of P[C] very, very far down.  And those are a lot of patterns that could be construed as bearish we've seen in the past couple of days... a potential double top, two potential heads-and-shoulders...

I like this count for several reasons, mostly because the wave [ii] and [iii] especially seem to look like a typical 2- and 3-wave.  The wave [ii] retraces a large amount of wave [i] (and wave (ii) of [iii] retraces a large percentage of wave (i) of [iii]), and it allows that weeklong advance to be a highly extended wave (iii) of [iii] rather than wave (iii) of [i].

The past few days have been characterized by a futures overnight selloff, rally into midday/early afternoon, then a selloff into the close.  This is perhaps more typical of wave 4 behavior than the wave 2 I have it labeled in both main counts, but I can't find a satisfying place to put the wave (i) and (iii) if that is in fact the case. 

As for the dollar, it is still annoyingly down and has breached its May low of 73.51.  The EURUSD went well above 1.4459 and past most other retracement levels.  This lends credence to the idea that the dollar is approaching - or made today - a major wave 2 low, possibly of Cycle degree as Daneric suggests.  Further evidence of this possibility is that virtually everyone, including many contrarians, is bearish the dollar - and the fundamentals for it are rather bad, which is normal for wave 2 of a bull market.  Is hyperinflation really about to happen when so many people are worried that it is about to happen?

The KRAP closed down 2.68 points today at 1631.87, led by a selloff in shoes.  Not even the power of the church of Appledom combined with a recovery in LULU (which had sold off yesterday) could prevent a down day.

Monday, July 25, 2011

7/25/11

SPX:


The S&P 500 closed at 1337.43 down 7.59 on the day.

I hold that this correction is Minuette (ii) of Minute [iii] of Minor 5 of Intermediate (C) of Primary [B].  It may have actually already entered Minuette (iii), and today's morning rise was Subminuette i with the afternoon reversal Subminuette ii.  If this is the case, the markets should rise strongly going into tomorrow (perhaps gapping up), as we will be in iii of (iii) of [iii].

I suspect however that Minor 5 is going to take the form of a petering-out wave where wave 1 (in this case, Minute [i]) is the longest and strongest.  According to this wavecount, the length of Minute [i] is 93.61 SPX points.  I expect Minute [iii] to be approximately the same length as Minute [i], which would put the endpoint of Minute [iii] at ~1389.53.  Minuette (iii) may get close to that, and Minuette (v) should reach or slightly exceed it.  (i.e. short term target 1390).  Minute [iv] may then pull back to the 1360s, followed by another thrust upwards which I expect to be .618 the length of Minute [i]/[iii], bringing us to ~1420 as the top of Minor 5 and Primary [B].

The EURUSD appears to be in a falling wedge.  Taken from the May 3 closing price, the upper line of the wedge almost perfectly aligns with the June 7 and July 4 highs.  It crosses 1.4459 tomorrow, the point at which the rise from July 17 (which I suspect to be a C wave) will be the same (1.00x) price-wise as the rise from July 11-13 (which I suspect to be an A wave).  I would thus not be surprised to see a thrust to the 1.4459 area tonight or tomorrow so that the wedge may be met again and this Fibonacci ratio will be satisfied.  (It also does not appear that we have had wave 5 of C yet, and have been going sideways in wave 4 since Thursday.)  Disclosure:  I am long UUP.

As for the Keller Ridiculous Adoration Portfolio, not even the combined counter-forces of yoga, burritos, comfy shoes, iPads and hyped social networks were sufficient to overcome the downward market forces today.  The index closed down 2.98 today at 1634.55.  The primary contributor was LULU, which was down almost 2.5% today and which could not be overcome by the four other stocks in the index, at least not the way I have the index set up.

Saturday, July 23, 2011

The Ridiculous Adoration Portfolio

The Keller Ridiculous Adoration Portfolio (KRAP) is, essentially, a stock index like the S&P 500 or the Russell 2000, except with the minor aspect of me having just made it up a few days ago.  It is definitely not my actual trading portfolio, and if it were, I would probably give serious consideration to changing it soon.  I just call it "portfolio" because it makes the acronym better.

The index's value is equivalent to that of owning 1 share of AAPL, 1 share of CMG, 1/2 share of GOOG, 5 shares of LULU, and 10 shares of CROX.  The reason for these particular companies is that they are go-go stocks, media darlings, etc.  While AAPL and GOOG's valuation is understandable, there seems to be little more than speculation over the other three stocks in the index.  It is a valid index up until the day at which LULU (the last of these stocks to IPO) had its IPO - July 27, 2007.

The weekly close on the first day of validity was 1105.50.  It closed out the week of October 26, 2007 (aka peak stocks) at 1471.90, before falling with the Great Recession to 284.19 the week of November 21, 2008 - a loss of over 80%.  Since then, it has risen - skyrocketed, even, particularly in the last month:  On June 13, 2011, the index stood at 1288.91, its lowest value since the end of March.  On July 22 (last Friday), the index closed at 1637.54 - an increase of 27% in six weeks!

Ahh, wave 5 speculative hysteria... how amusing you are.  Shame this wasn't my real portfolio, or I'd be taking profits right now.